Understanding the Data Landscape and Strategic Play Through Wardley Mapping

A Wardley map is a form of mapping invented by Simon Wardley (@swardley) that helps you understand business strategy. Simon calls it a form of "topographical intelligence." Having studied business strategy on my own for a while, I was super interested in a tool that distilled all the aspects of strategy in an easy to understand format and can be learned for free online. You can go and read the entire book for free on Medium here or see an introductory video
Wardley Mapping and the Strategy Cycle
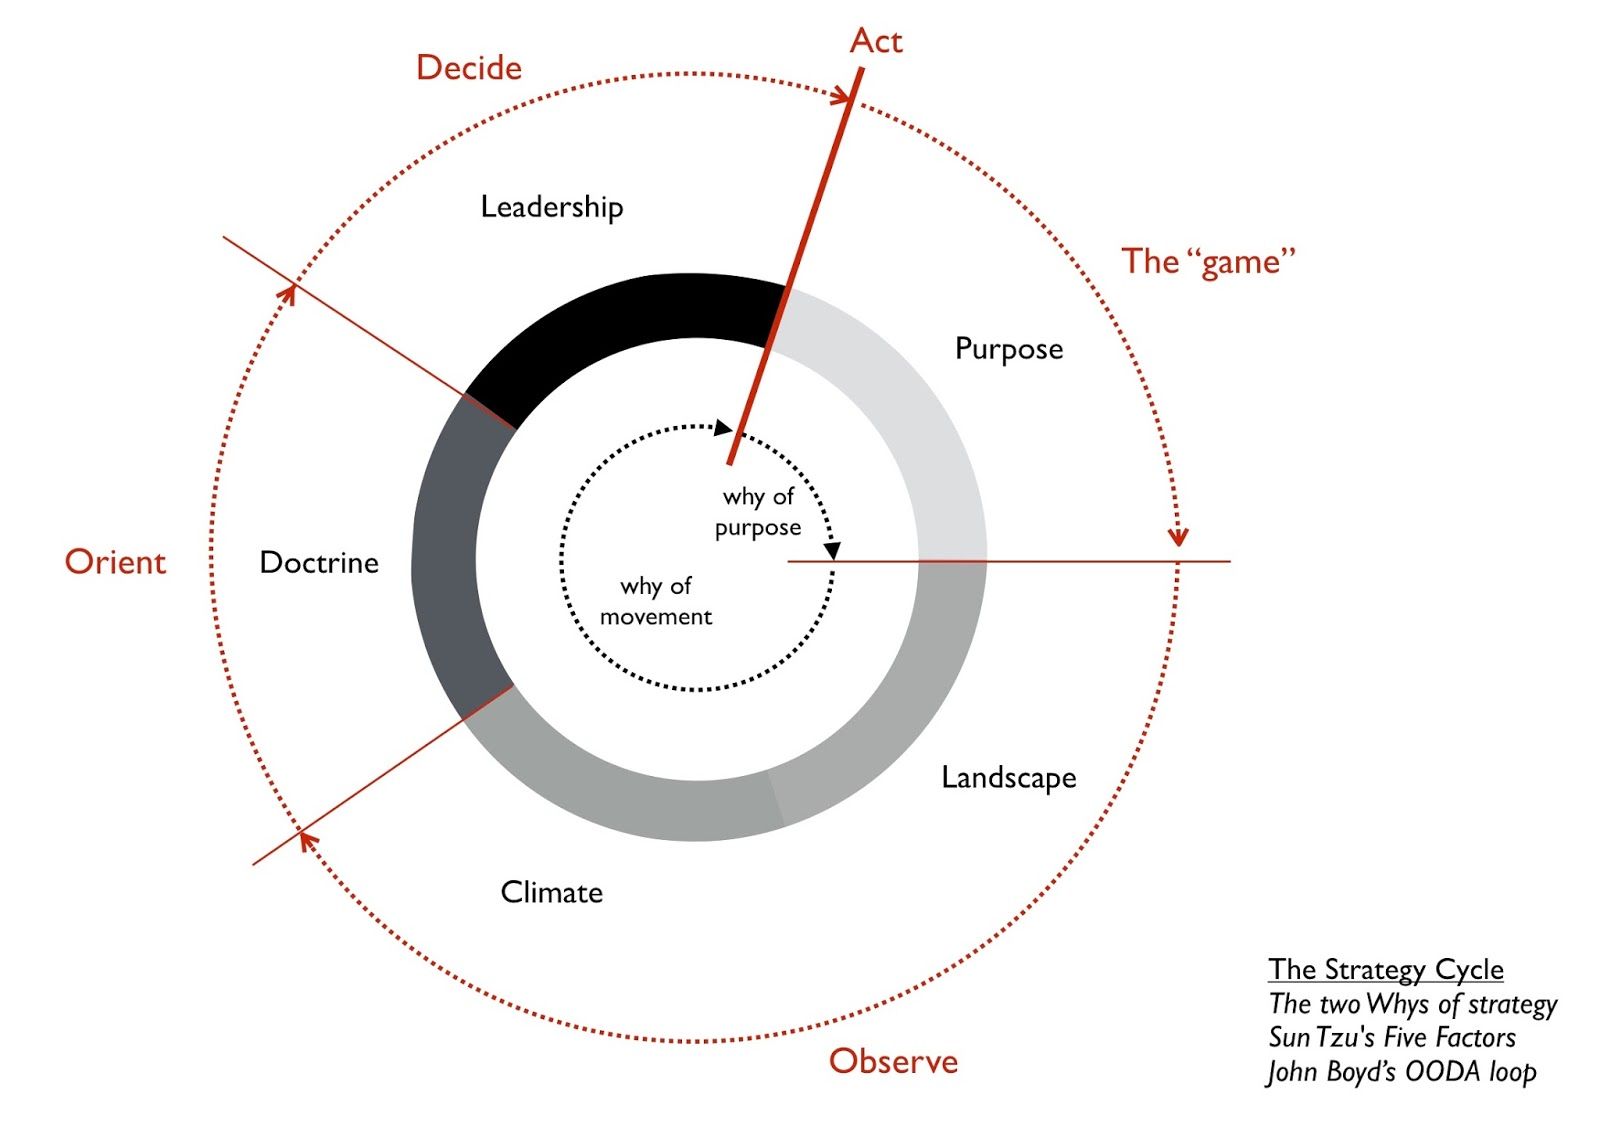
The strategy cycle is made up of five factors:
Purpose: Your moral imperative is the scope of what you're doing and why
Landscape: A description of the environment where the business operates
Climate: The forces that act on the environment regardless of your actions
Doctrine: Universal principles applicable to any industry regardless of landscape and context
Leadership: The strategy you choose given your purpose, the landscape, climate, doctrine and your capabilities
As you can see in the image below, the whole point of strategy (aka the game) is to observe the landscape and context your business finds itself in through the Landscape and Climatic patterns, Orient yourself via Doctrine and make a strategic decision on how to play through Leadership. These stages fit in quite nicely with Boyd's OODA Loop.
The map lets us see all the above in a visual way making strategy easier to understand and apply.
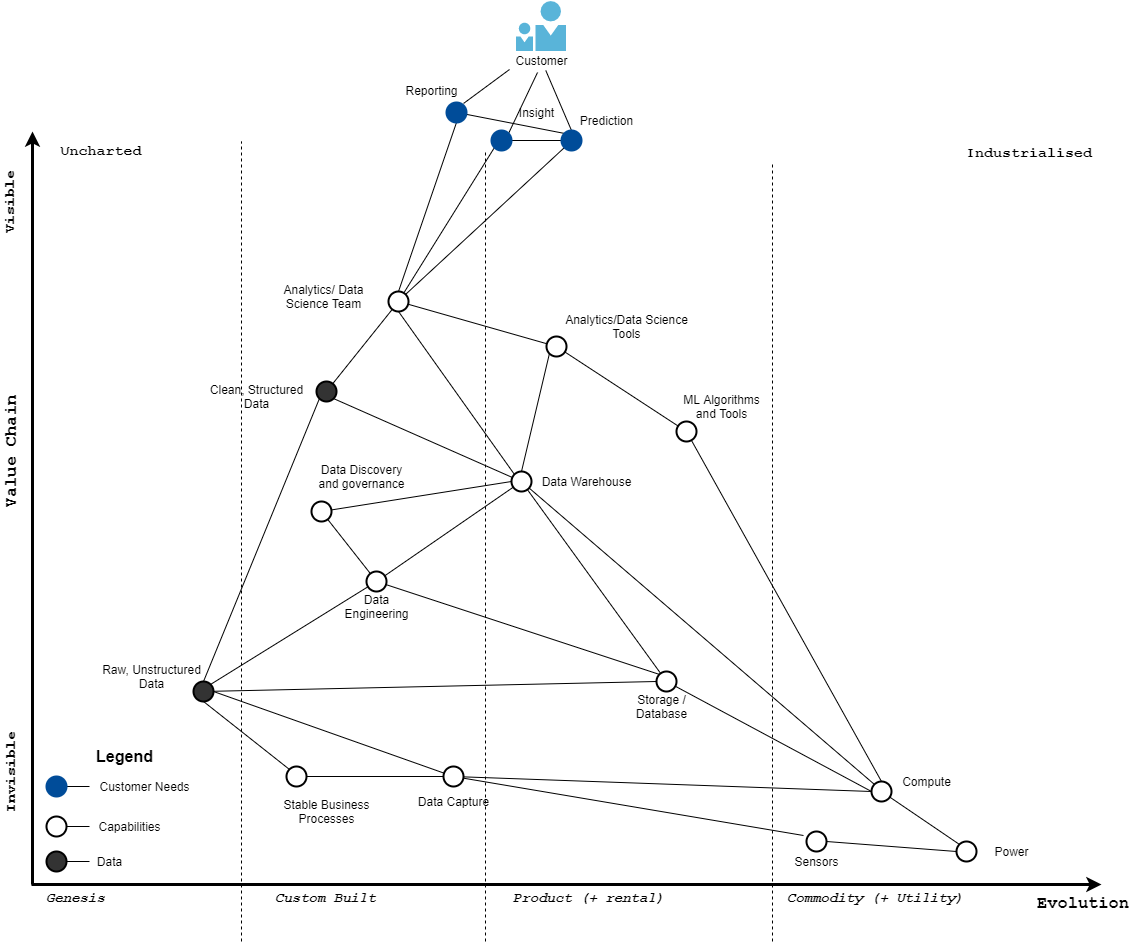
In a nutshell, a Wardley Map is a visual representation of an entire business, or a single line of business, or an industry, expressed through the value chain in the Y axis and the evolution of the components of the value chain in the X axis. The map is anchored at the top by user needs and value chain goes from invisible components that the users never see or think about to the visible components that matter to them.
The X axis shows the natural evolution of components from genesis where everything is uncertain, towards utility where things are fully predictable and components get commodified; from the uncharted to the industrialized. This happens due to economical forces of competition.
Mapping the Data Landscape
The map below provides a visual representation of the data landscape. It has several important characteristics: it's visual, it's context specific, it has an anchor which determines the position of the elements or components of the map, and it has movement. Maps provide an alternative to narrative based strategy because they create richer situational awareness. Situational awareness in turn enables more context specific decision making.
Customer Needs
To understand this map let's start with the customer needs. The black lines indicate the needs chain. Data customers (in many cases business stakeholders) have a need for reporting, insights and predictions/forecasts.
Stakeholders use a combination of reporting, insight and prediction to get a sense for how the business is performing, what it's trending towards and how to best allocate resources to improve processes and serve customers better.
The output of predictions is used both in decision making and in user products (e.g. product recommendation and personalization)
Analytics and Data Science (DS) Teams
In order for the above customer needs to be satisfied organizations need to build up an analytics and data science capability. This component is highly customized to whichever organization it's built in, even if the skills themselves are not custom, which is why it sits in the Custom stage.
Let's continue further down the value chain.
In order for the analytics and DS teams to work effectively and create value they require tools such as data warehouses, machine learning algorithms, data visualization, model maintenance and deployment, and of course their source is clean structured data.
There are many cases where analytics and DS teams don't have clean structured data and have to work with raw data - in fact many companies start out this way - but as they grow, they build a data warehouse with clean structured data to improve the analysts' and data scientists' effectiveness.
Data Warehouses and Structured Data
Possibly the most important component in the data value chain is a properly designed data warehouse. It's relatively hidden away from the end users but it's vital to analysts and data scientists. While the individual data warehouse instance for a particular organization is always custom built - because the data is always custom to that organization - the underlying technology has become productized so I placed the component in the product stage.
Traditionally data warehouses were built in house, on top of relational databases or purpose-built appliances (like Teradata) These days, offerings like Google BigQuery, Snowflake, Redshift and Azure DW allow data engineers and analysts to quickly build data warehouses on top of proven technology and not worry about maintaining a server farm. Having seen both, I prefer the cloud offerings.
Clean, structured data is one of the core sources of competitive advantage in today's modern organizations, which is why it sits in the custom build stage. It is in this stage that raw data is cleaned, systematized, de-duplicated and enriched with data from other areas of the organization to make it even more valuable.
This component cannot exist without raw, unstructured data generated by business processes, sensors and other mechanisms of data capture. Knowing what raw data to capture to ensure more signal and less noise is they key, however it's such a hard problem that many organizations just don't bother. With storage being dirt cheap "capture everything and we'll sort it out later" is the default motto.
Think of unstructured data as iron ore that gets extracted from the mine and the structured data as steel slabs, billets and blooms that are used directly in everyday construction. You don't see trucks bringing iron ore to a construction site for it to be smelted, mixed with carbon and turned into steel before use, yet this is exactly what some organizations are still stuck with.
Data Discovery and Governance
Data warehouses typically need data engineering both to build them and to maintain them. A data warehouse is very valuable just by itself but if you add data discoverability to it, you multiply its value. Data discovery allows analysts and data scientists to find information about the data stored in the warehouse.
This component stores information about the tables and views in the data warehouse, their column names and descriptions, their permissions, when it was last refreshed, who owns it, etc. and any documentation. This information drastically reduces the time it takes for analysts and data scientists to provide value which is why many tech companies are building their own.
Data discovery is usually bundled with another component that used to be called "data governance" The name is old and boring but this component plays a key role in ensuring the proper permissions are set and followed around who can access data (e.g finance data can only be seen by the finance team)
Invisible Components
We are now entering the area of the map that's barely visible to the end users, yet crucial to the delivery of value. Raw data needs data capture which may require sensors. These sensors, as you see on the map, are already fully commoditized and industrialized, you simply buy them off the shelf. These can be GPS chips, motion sensors, cameras, heat and light sensors, pressure sensors, etc.
Data capture will also require storage and compute components since these could be code that runs and collects activity logs every time a process runs or a user does something. Storage is usually a product in the form of databases whereas compute these days is outsourced to the cloud.
Finally at the very bottom we have Power (electricity) that powers the data centers. Unless this is completely necessary (like a hospital or military base) you will most likely not need your own power generation and you simply outsource it to the cloud provider.
Evolution and Climatic Patterns
The first climatic pattern in Wardley Maps says that everything evolves from left to right under the influence of supply and demand competition. This includes activities (what we do), practices (how we do something) and mental models (how we make sense of things) We've already encountered this earlier and now we're now making it official.
Here's an updated version of the map showing how all the components evolve.
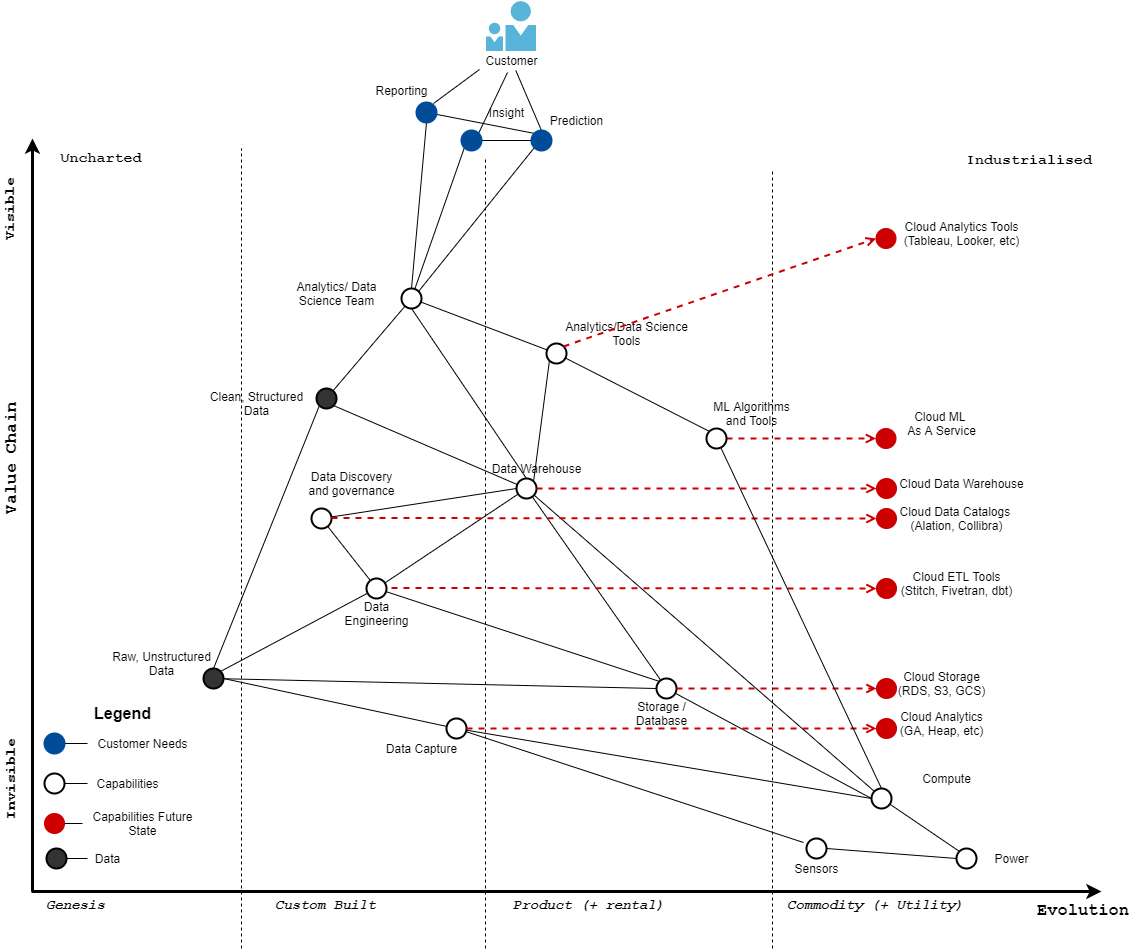
What we see here in red arrows is the direction of evolution of all the components that can evolve. So for example we've already started to see analytics and data science tools slowly evolve towards the cloud and become components that you can simply rent.
We've also seen data analytics tools (Tableau, Looker, etc.) data warehouses (BigQuery, Azure DW, Redshift, Snowflake, etc.) data engineering tools (Stitch, Fivetran, dbt Cloud, etc.), data discovery/governance tools (Alation, Collibra, etc) cloud storage (S3, GCS, etc) and even data capture tools in the form of product analytics (like Google Analytics, Heap, etc.) start to evolve towards the commodity/utility stage.
Notice that analytics tools like Tableau and Looker have started to bubble up towards becoming more visible since the end users interact with them directly. Thanks to my friend Saul for pointing that out.
What this means that if you were a brand new organization starting from scratch, you could rent out pretty much all the components of the data stack from data capture, to transformation, to storage and visualization and be up and running with analytics in a matter of days vs. the months (and sometimes years) it used to take.
You'd still need an in-house data science and analytics team, because I strongly believe this component cannot and should not be outsourced as it provides the core of your competitive advantage. When your data starts getting bigger and more complex, you might also want to build out a data engineering function in your organization.
Strategic Gameplay
We've finally arrived at the most interesting and fun part of the map. How to use it to drive strategy. I intend to cover things in more detail in a future post so for now a few quick ideas should suffice.
If you're an executive, your most important job is to use this map to assess the capabilities in your organization, figure out what you need and then decide how to build the missing components. Should you buy, rent or custom build it yourself?
For example if your organization doesn't have a data warehouse that unifies all the sources of business data in a single location, you should build that first before you grow the analytics and data science teams. If your data warehouse exists but its adoption is low, you might need the data discovery component so your analysts and data scientists can find what they need faster.
On that note, here's a case study of how Spotify increased their data platform adoption from 75% to 95% by building a data discovery tool.
If you're a data analyst, data scientist, machine learning engineer or data engineer, you can use this map to ask questions during an interview process that will help you understand the data maturity and capabilities of an organization. This crucial information can help you accelerate your career, when the organization has the right components in place, or hinder you, when the organization is not ready for data science so you end up becoming a data engineer writing custom ETL code.