The Data Executive Playbook: How to use Wardley Maps to Determine Strategy in Modern Organizations

This blog post is an exploration of strategic play inside an organization viewed through the lens of a hypothetical data executive. Since I've never been an executive in the data field, my approach to this question will be entirely from first principles. I'll use Wardley Maps to assist me. I covered a very brief introduction to Wardley Maps on this article. This can be thought of as the next part in the series.
Elements of Strategy
As discussed in the previous article, strategy is comprised of 5 factors
1. Purpose: Your moral imperative: what you're doing and why you're doing it
2. Landscape: A description of the environment where the business operates
3. Climate: The forces that act on the environment whether you choose to act or not
4. Doctrine: Basic universal principles applicable to any situation regardless of landscape and context
5. Leadership: The strategy you choose given your purpose, the landscape, climate, doctrine and your capabilities
So to get started you need to know your purpose and get a sense of situational awareness.
Purpose
The purpose finds itself the most neglected part of many strategies. It's usually something vague, grandiose and ridiculous that's rarely taken seriously. A well-crafted purpose should act as a moral imperative that "rallies the troops" and makes everyone feel part of a larger mission.
After conferring with you settle on this as your purpose: "Build a data obsessed organization by making data driven decisions and data powered products ubiquitous"
What's great about this purpose is that it suggests some ways forward and once it reaches critical mass, it becomes an ever-improving loop of learning where the stakeholders continuously demand higher quality data products (dashboards, insights, forecasts, etc) and your team gets better at delivering value.
Landscape
You decide to use Wardley Maps to get a sense for where the business stands with respect to data capabilities because maps are visual and give us a much better sense of situational awareness. With maps, strategy is that much easier to determine.
A good place to start is the map we designed in the first article to showcase the overall data landscape
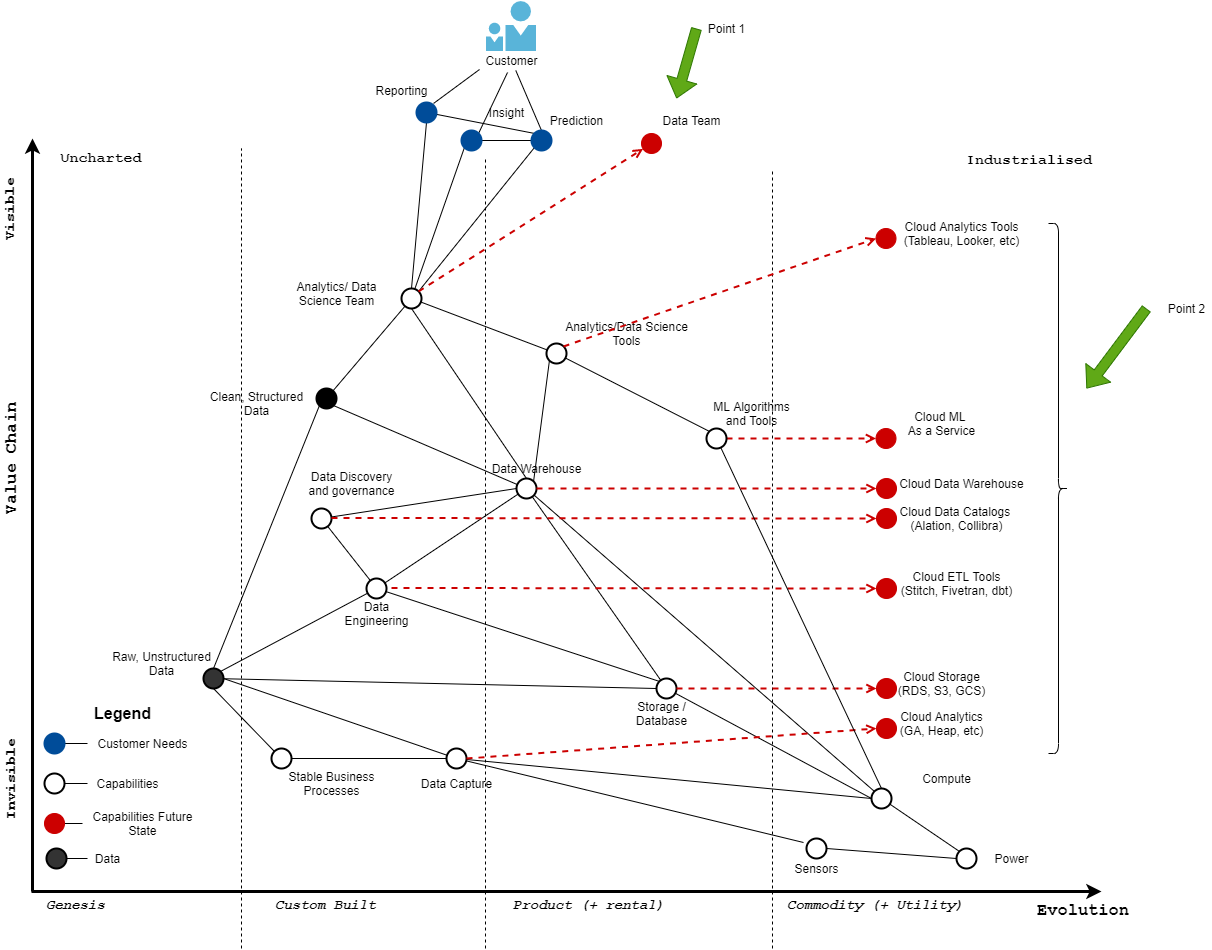
There are two important points I want to highlight in this map
Point 1: New Customers
The Analytics/Data Science team is now under your purview and it becomes a new customer of yours with their own specific needs. These needs range from whatever they need to perform their job effectively, (like tools and infrastructure) to the way they're organized and the processes they follow to deliver results. The stakeholders are still your customers, that doesn't go away, so that's another domain you have to think about.
Point 2: Infrastructure
Assuming you're in a relatively new organization without a lot of existing infrastructure to worry about, you can build your entire data stack quickly on the cloud. You get to choose a cloud data platform (BigQuery, Snowflake, Redshift, Azure), cloud ELT tools (Stitch, Fivetran, dbt, Holistics, etc) which you'll use to populate the data warehouse and cloud analytics tools (Looker, Tableau, Superset, etc)
For a more detailed look at modern data infrastructures, check out this excellent article from a16z.
Here's what the update map looks like.
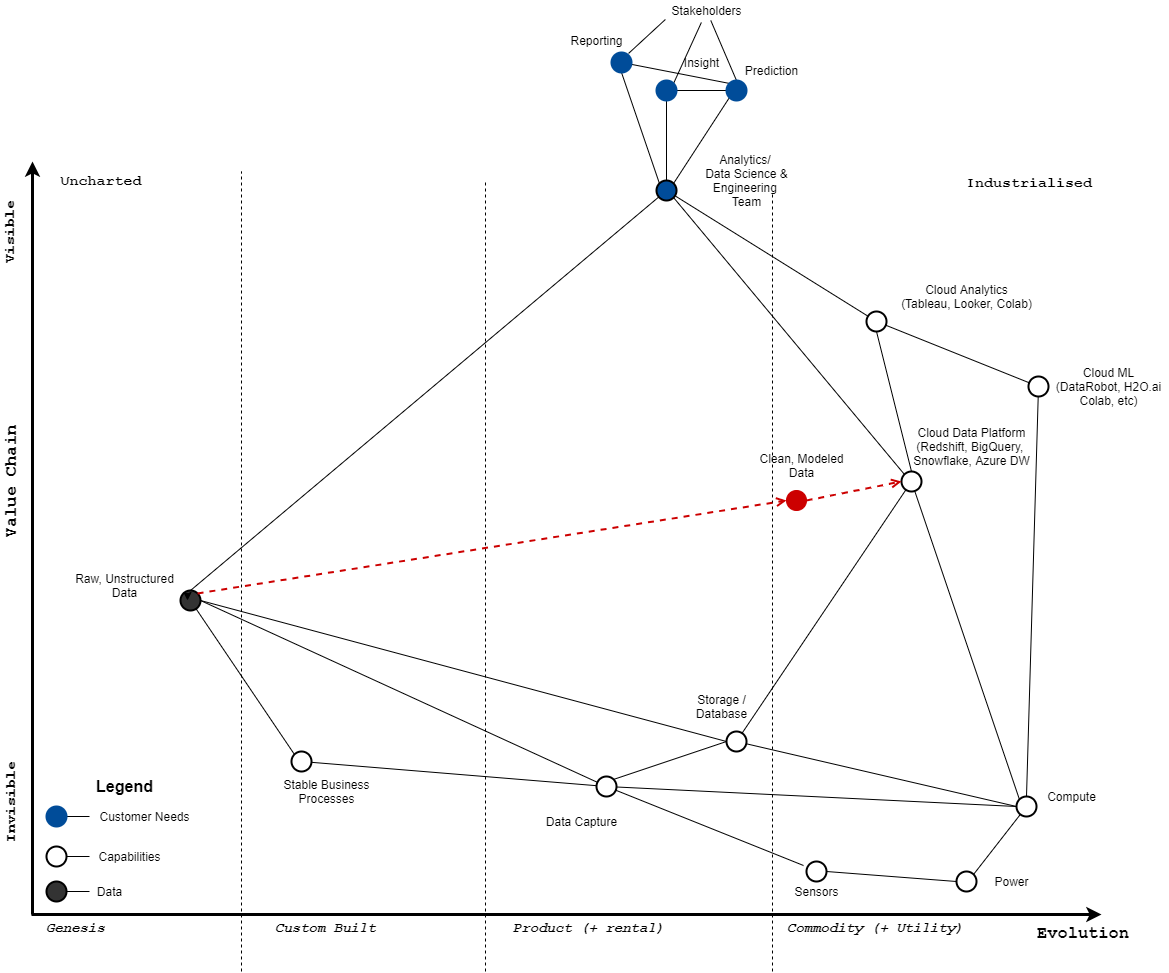
In the updated map, we now see that the Analytics/ Data Science & Engineering team has moved up and become a customer but it still has ties to the stakeholders. Almost all the components are on the Commodity (+ Utility) stage because you chose to build your data platform entirely on the cloud.
Some components like Data Capture and Storage are still on the product stage since these will most likely be internal applications built with pre-existing products like databases.
The Raw, Unstructured Data component remains on the far left as this is the raw material upon which you'll build your data models that will serve as the basis for reporting, dashboards, forecasting and later on data science.
In Wardley Maps, data start out as unmodeled and move towards the right as fully modeled, cleaned and structured. I've indicated this with a red, upwards pointing arrow to indicate that as the data gets modeled, it also gets more visible as it ends up in your cloud data platform.
Of course you cannot have good quality raw data without Stable Business Processes. These processes need to be very well defined and modeled by software engineers because if these processes are in constant flux, the underlying data becomes very messy and requires a lot more effort to clean and model into structured form.
Note: It’s really easy to miss the importance of stable business processes when it comes to raw data. If a company is still experimenting with its business model, the accuracy of the raw data is very likely to suffer given the rapid nature of experiments being conducted and decisions being changed. The best you can do is to evolve reporting alongside the business model while making sure everyone is aware of the quality of data. I've learned this lesson the hard way.
Climatic Patterns
Now that we have a map in place, let's explore some of the climatic patterns and doctrines that are part of Wardley Mapping. Remember that climatic patterns are the forces that act on the environment whether you choose to act or not. There are too many patterns to list here so I'll focus on just a few. Some of them are data specific and don't appear on the Wardley Mapping book.
Climatic pattern: Metrics become targets (data specific)
If not carefully designed, metrics become goals and well-intentioned people will focus too hard on improving them to the detriment of everything else. When a metric becomes a target it ceases to be a good metric (Goodheart's Law)
For example if you choose revenue as a key performance indicator (KPI) and you optimize everything against it, you will become so tunnel-vision-focused that you will miss opportunities to expand your business or red flags that your business model may no longer be viable. As a data executive it's your job to design good metrics that are hard to game. I highly recommend John Doerr's book on OKRs.
Climatic Pattern: Everything evolves
One of the core patterns of Wardley Maps is that everything evolves from left to right, every activity (what you do), practice (how you do it) and every mental model (how you make sense of it) evolves from the Genesis stage where it's brand new and unknown towards Commodity stage.
You'd be more interested in keeping up with how data practices change. They go from Novel to Emerging, to Good and finally to Best Practices. For example, using Jupyter notebooks was a Novel practice only a few years ago but these days it's become more of a Good practice as it gets adopted in more data teams. The same applies to how you design metrics.
Doctrine
Doctrine: Focus on user need
Possibly the most important of all the doctrines is the focus on user's needs. What this means in your case is to focus on both stakeholder needs (problems, questions, decisions, reports, etc.) as well as team needs (new hires, re-organization, new tools and systems, etc.)
Doctrine: Use a common language
Another very important doctrine that's very applicable to data teams is using a common language when communicating. Specifically for data teams and stakeholders this language is well-defined metrics.
Probably the most problem inducing thing in organizations is the use of metrics that mean different things to different people. In many cases the same metric means different things to different departments.
What does conversion rate mean to sales vs marketing? What does CAC (customer acquisition cost) mean to finance vs marketing? Getting everyone on the same page regarding what metrics should be used can be achieved by designing a company wide scorecard with agreed upon metrics.
Doctrine: Measure the right things
If you have a product you need to use lean and measure certain things but if you have a utility you need to measure. Don’t measure things you can’t do anything about. Vanity metrics like page views don’t tell you anything valuable.
Doctrine: Think small
When starting out with a blank slate, the most important thing to do is to deliver value quickly. This typically means some kind of company wide report or dashboard. Before you undertake a massive effort to model all the business processes in the data warehouse, start with a small, well-defined dashboard that shows the key performance indicators (KPIs) of your business. This will help motivate the team and get you started on the right foot.